4 Google Analytics Techniques To Measure SEO Improvement Results

Legendary management consultant, Peter Drucker, is often credited with the statement: “What gets measured gets improved.” Although he made this statement a couple of decades ago, it still holds true today, even for SEO (Search Engine Optimization) and digital marketing in general. If you've been doing SEO, you probably have been measuring your SEO results to see where you stand. But one mistake most beginner SEOs often make is tracking a single metric — keyword rankings.
The problem? Tracking solely the keywords doesn’t paint the full picture of your SEO. It undermines the effectiveness of your efforts. The right approach is to track multiple important metrics. This allows you to see what matters and shows you the areas you need to optimize in order to bring in more revenue and profit for your business. So how can you reliably track and measure your SEO results for improvements? It turns out one of the best tools to use is Google Analytics (GA).
WHAT IS GOOGLE ANALYTICS?
Google Analytics is a web analytics service, owned and run by Google, that provides statistics and basic analytical tools for SEO and marketing purposes. The tool tracks and collects website user information using a tracking code. It then processes the information and prepares comprehensive reports. Google launched the service in November 2005 after acquiring it from Urchin.

The best thing about Google Analytics is that it is free, yet it packs a bunch of great features.
GOOGLE ANALYTICS TECHNIQUES FOR IMPROVED SEO RESULTS
Ready to use GA to run better SEO campaigns? Here are four actionable techniques for doing just that:
1. Measuring the Quantity of Organic Traffic
When it comes to SEO, the first metric you probably want to track is the overall amount of search engine traffic your site is getting. This kind of sets off the work for the rest of the metrics. Why? Because the total amount of organic traffic is the first indication of how your website’s SEO is doing. Here's how Google Analytics tracks organic traffic: Any time a unique visitor lands on your website, Google Analytics tracks that user by assigning them a unique client ID usually stored in a cookie in the user's browser. GA then keeps count of how many unique visits your site gets. And then, there's what is called “Sessions.”
Google Analytics records a “Session” every time a user visits your website just as with unique visits. But in this case, a session starts when someone loads a page on your site and ends after 30 minutes of inactivity. If that same visitor comes back hours later, a new session is recorded. Which means, one person can log multiple sessions but not multiple unique visits (except when they visit from a different browser). Now, to see an overview of your total traffic in Google Analytics, you'll simply have to go to the “Audience” section. It shows you how many sessions there were on your site during a given period of time. But this is not totally clear as it doesn’t show you which part of that traffic comes from the search engines. It just shows you the total traffic to your site from all sources — search, social, direct, referral, etc. So to find the traffic that’s coming directly from the search engines, you’ll need to dig a little deeper. Simply open your Channel Grouping report which you can find by clicking Acquisition > All Traffic > Channels. On there, you will see traffic sources segmented by channels as shown below:

When you click on “Organic Search” you will get a more detailed report covering only organic search traffic metrics.

This is the report that can help you determine things like:
-
Which search engines are sending you the most traffic
-
Keywords driving the most traffic
-
The top-performing landing pages for search traffic
-
Top exit page for search traffic
-
And so on.
Here are some more things you can do on this channel:
-
If you want to see all the organic traffic combined into one, simply click the medium tab.
-
If you want to see records from specific search engines, select the particular search engines.
-
If you want a more visual presentation, you can just hit “Plot Rows” to see a graph of the total traffic and lines in other colors for the sources you’ve selected.
-
If you want a view that’s a bit more precise, you can click the pie chart icon to see the exact numbers and percentages of the total.
With this insight on your site's overall search engine traffic, you should be able to know which areas to focus your SEO improvement efforts on.
2. Measuring the Quality of Organic Traffic (Website Conversions from Search Engine Traffic)
While the quantity of search traffic is certainly important, it'll only come to nothing if all that traffic is not of quality (that is, if the traffic is not converting). That's why measuring your SEO traffic quality is so significant. And with Google Analytics, measuring the quality of your site's organic traffic couldn't be easier. To measure an increase or decline in the quality of search traffic, you can easily use the Assisted Conversions report in Google Analytics. Simply go to Conversions > Multi-Channel Funnels > Assisted Conversions.

How do you actually get a sense of traffic quality? With this report active, set the date range to “Last month” and compare it to “Previous period”.Once you've done this, you'll be presented with a month-to-month comparison of conversions of organic traffic. In the event of multiple visits to your site, there'll be the inclusion of conversions where search played a role but is not directly attributed with the conversion. For example, a user found your business through search, but came back through the direct visit and converted. This is called “Assisted Conversions.”
Your focus here should be to detect a decline or improvement in conversions from search traffic. If you notice a decline in conversions from search when running the comparison, yet your overall search traffic is steady or increasing, it means that the traffic coming from search is not high quality. If it is otherwise, you can say that your SEO traffic quality is great.
Another way you can track conversions on GA is through the “Goals” feature. To do this, you first need to set up Analytics Goals. Once that is in place, go to the Channels report to view the Goals for Organic Search traffic.
If you run an eCommerce website, then you might want to also set up eCommerce Analytics. This helps you track the exact revenue generated from your search engine traffic. Setting up eCommerce Analytics is easy. Simply change the Channels report from Summary to eCommerce in the “Explorer” navigation above the graph to view revenue from Organic Search traffic.
3. Tracking Mobile Traffic
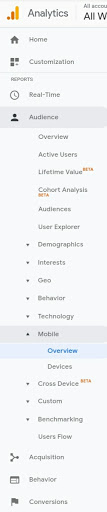
In 2018, Google switched fully to mobile-first indexing. Mobile-first indexing means Google now predominantly uses the mobile version of the content of a page for indexing and ranking. Historically, the index primarily made use of the desktop version of the content of a page when evaluating the relevance of a page to a user's query. So for your site to perform well in rankings, it has to be mobile-friendly. If it is otherwise, then chances are that it won’t rank in mobile search results. And statistics show that 52 percent of Internet users now access the web with mobile. So here's what to do: On Google Analytics, go to Audience > Mobile > Overview.
On there, you’ll get a dataset that shows you how many people are visiting your website using a desktop, a mobile phone, or a tablet. You can click on the pie chart icon to get a good view of this dataset. If the number shows that a significant amount (say at least 10%) of the traffic coming to your site are doing so via mobile, then you should definitely optimize your website for mobile. But first, use our Mobile Friendly Test tool to test your site to see how mobile-friendly it currently is. Mobile optimization is so vital for a successful website given that Google now uses mobile-responsiveness as a ranking factor.
4. Measuring Page Load Times for Organic Traffic
As with mobile-friendliness, site speed is also a major ranking factor. Thankfully, Google Analytics can prove a handy tool when it comes to site speed optimization. Here, we aren’t going to talk about how to make your website load faster (we already covered that extensively on this post). Instead, we'll look at how to identify slow loading pages and measure their impact on conversion rates and on the usability of your site. Google Analytics has a special Site Speed section for this. So first off, go to Behavior > Site Speed > Page Timings. This is for measuring page load times on a page-by-page basis.

Typically, you’ll get a quick overview of pages that are “slow” which immediately gives you a to-do list of pages you need to optimize first.For the best result, set the middle column to “Average Page Load Time” and the right column to “% Exit.” You can also add a “Secondary Dimension” of Medium and filter down to show only organic traffic.In the topmost row of this report, you'll see the average page load time site-wide, and the average exit percentage (that is, where a visitor decides to leave the site) on a page-by-page basis. You'll also notice in this report that as your page load time eclipses your site-wide average, your exit percentages begin to increase significantly.At this point, our recommendation is for you to optimize the page load times. (Here is a post we wrote on the subject.) Once you've done this, run the same report again and compare it to the old data to see how much additional search traffic you've obtained.
You Can Visit Our Completely Free SEO Tools by SmallSEOTools.com.