Mean, Median, Mode, Calculator
Our mean calculator allows you to calculate mean, median, mode, and range for a given set of numbers. Use this mean, median, mode, and range calculator for accurate results.
What is the Mean?
The term "mean" represents the central value within a set of numbers. The mean value can only be calculated for numeric values of both types (discrete or continuous). Anyone can perform this calculation online with the help of a mean calculator. Mean can be further divided into different types, like arithmetic, geometric, and harmonic mean.
Arithmetic mean
Here a question arises how to calculate mean? Simply add all the values of a dataset and then divide it by the total number of values; the resultant will be known as the Arithmetic Mean.
Formula:
The formula to find mean is:
Mean = (Sum of all the observations/Total number of observations)
x̄ = ΣXi/ n
Example:
Suppose, the dataset is 7,6,9,4,5,6,8
Arithmetic Mean = 7+6+9+4+5+6+8/7 = 45/7= 6.42
A.M = 6.42
Geometric Mean
In Geometric Mean, the values will multiply instead of adding up, and then you have to take the 1/nth after multiplying the values in a data set. For two values you will have to take the square root and for three values you will have to take the cube root or for four values you have to take the 4th root, and so on. With the increase in the values, the process becomes complex to avoid this hassle take the assistance of an online mean calculator.
For instance, let’s consider three values 4,6,2,
Geometric Mean= 3√ 4*6*2= 3√48= 3.63
G.M = 3.63
Harmonic mean
The Harmonic Mean is the reciprocal of the average of all the reciprocals of the dataset.
For example, for the numbers, 2, 4, and 7
Add all the reciprocal of these values = 1/2+ 1/4+ 1/7= 0.5+0.25+0.14= 0.89
Divide by total numbers= 0.89/3
Reciprocal of the value = 3/0.89= 3.37
You no longer need to follow the manual processes instead utilize our mean calculator for all types of mean calculations.
When to use mean?
The mean is the most useful and famous measure of central tendency. The mean is mostly used in both discrete and continuous data. However, it is often used in mathematics or accounts-related work, in which persistent data is mainly used.
What is the Median?
The median of a dataset is taken as the middle value, but the dataset should be arranged in ascending or descending order. Find median effortlessly without formulas using our median calculator. In simple words, the median is a type of average, which is used to find the center value.
Formula:
Curious about how to find median of the data set using the formula:
Odd Number of Observations
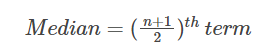
The formula to calculate median if the total number of observations is odd:
where n is the number of observations
Even Number of Observations
The formula to calculate median if the total number of observations is even:
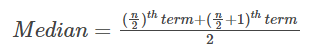
where n is the number of observations
Example:
For instance, if you want to find median for the dataset, 7,9,4,3,6,1,2, then you should first arrange the numbers sequence.
It would become: 1,2,3,4,6,7,9
There are seven values in the data set. So, the middle value is the fourth number
The median value of this set of numbers is 4.
While working with larger datasets, calculating the median can be a challenging task. Simplify the process by utilizing our median calculator.
When To Use Median
The median is widely used in academics but proves as the best option when you have a skewed distribution and want to find the central tendency.
What is Skewed Distribution? A skewed Distribution is a set of values in which one of the tails is longer than the other. It becomes crucial in some cases to find the central value of such data, and the median becomes helpful at that time.
What is the Mode?
The mode in an equation is the value that appears most frequently in a data set. An equation may have one or more than one mode value. Similarly, an equation may also have no mode.
How to find the mode in ungrouped data?
- Jot all numbers in a given set in order.
- Count how many times each number appears in the set.
- The one that appears for maximum time is the mode.
For instance, in the data set, 8,4,9,1,4,2,4,1,4,9,3, you can easily find out that number 4 repeats most of the time. So, the Mode is 4. In the case of larger datasets, it’s quite hard to identify the most frequently occurring number. Make it convenient with our mode calculator instantly.
How to find the mode in grouped data?
- First, we will identify the modal class (The class that has the highest frequency).
- Find the value of h.
- With the help of the modal class, we will find the values of f0, f1, and f2.
- Find the value of the lower limit, L.
Formula
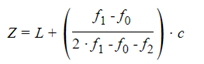
The formula for finding the mode in grouped data is:

Here:
h Is the size of the class interval
L is the lower limit of the class interval of modal class
f1 is the modal class frequency
f0 is the preceding class frequency
f2 is the succeeding class frequency
Example:
The following frequency distribution shows the number of goals scored per game by 50 football players:
| Points Scored | Frequency |
| 1-10 | 6 |
| 11-20 | 18 |
| 21-30 | 12 |
| 31-40 | 10 |
| 41-50 | 5 |
Let’s find mode. In this example,
Here, the maximum frequency is 18.
The mode class is 10.5-20.5.
L=lower boundary point of mode class =10.5
f1= frequency of the mode class =18
f0= frequency of the preceding class =6
f2= frequency of the succeeding class =12
c= class length of mode class =10
Now, inserting the values in the mode formula
= 10.5 + [(18-6) / (2 x 18 -6-12) x 10
Mode = 10.5+6.6667
Mode = 17.16667
When To Use Mode
The mode can be used in categorical, discrete, or ordinal data, but it becomes most useful when you are looking for a tendency from a large set of options. For instance, it can be used to find the favorite food of customers. Whenever there is a need to find mode take assistance from an online mode calculator.
What is the Range?
Range is the measurement of how much a given data set is stretched out from smallest to largest. In simple words, the range is the difference between the greatest and smallest value.
Formula
The formula to find the range of an equation is: Greatest Value - Least Value
Example
Your teacher asked you to read a book within a week. You read the following number of pages each day. Let’s calculate the range
Monday – 10 pages
Tuesday – 8 pages
Wednesday – 14 pages
Thursday – 6 page
Friday – 9 pages
Solution:
To find the range, place the values in order from least to greatest:
6,8,9,10,14
Now, Subtract the smallest value from the greatest value:
R = 14-6
The range of this data set is 8 pages.
How to Find the Range?
Just use the range calculator or follow the given below to calculate the range manually:
- Collect all your data.
- Place the data set in order from least to biggest.
- Subtract the smallest value from the greatest value.
- The resultant will be the Range of the dataset.
When to Use Range?
Teachers can use the range to find the difference between the highest score and lowest score received by students. It can also be used to calculate the amount of time that has passed. If a person is born in 2000 and the current year is 2022, then the person is 22 years old. The range is also used to determine the price range for a product, services, and many other purposes.
Features of Mean Median Mode Calculator
Our mean median mode calculator helps you calculate mean, median, mode, and range of any data set with a few clicks in one place. Some prominent features of this web-based calculator are shared below.
Accurate Results
This mean median mode calculator is based on advanced algorithms that process your input values and provide you with accurate output. The accuracy of the output taken by our calculator is guaranteed. You can also cross-check the value calculated by this mean calculator using any online facility.
Quick and Free to Use
Our mean median and mode calculator is an entirely free-to-use tool. Yes! You don’t need to pay a penny to find mean, mode, or media. Simply connect your device to the internet, reach this facility, and make calculations without any hassle.
All-in-One Platform
There is no need to explore different calculators to find median, mode, mean, or range in a given data set effortlessly. Our web-based mean median mode range calculator is capable of providing you with flawless calculations. Easily
FAQs
What Is the Difference Between Mean Median and Mode?
It is important to understand that mean, mode, and media are measures of central tendency. It clearly defines that the mean is the arithmetic average. The median is the middle value of any sorted dataset, and the mode is the value that appears the most in a given set. The mean and median in a given set will have the same value if the distribution is perfectly symmetrical.
When Will the Mean, Median, And Mode Be Equal?
The mean, median, and mode are equal when the distribution is perfectly symmetrical and non-skewed. As the distribution becomes more skewed, the difference between the three measures different becomes larger.
When we have a right-skewed distribution, the mean is larger than the median, and the mode is the value with the highest visual representation.
In a negatively skewed frequency distribution, the mean is lower than the median, and once again, the mode defines the highest point. Such a distribution is also called left skewed because the outliers are to the left.
How to Calculate Mean in Excel?
The arithmetic mean is also referred to as the average. This value is calculated by adding a group of numbers and then dividing them with the sum by total numbers.
In Microsoft Excel, you can calculate mean using one of the following functions:
- AVERAGE- it will return an average of numbers.
- AVERAGEA – It will return an average of cells with any data such as numbers, Boolean, and text values.
- AVERAGEIF – It will find an average of numbers based on a single criterion.
- AVERAGEIFS – It will find an average of numbers based on multiple criteria.